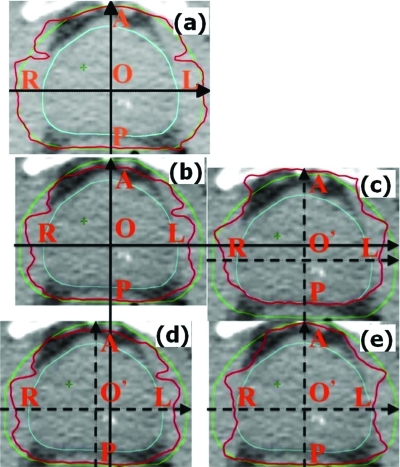
Figure 7.
Panel (a) is the nominal dose distribution for the PTV-based prostate plan. The remaining panels are the dose distributions for the robustly optimized plan: (b) nominal, (c) with patient shifted posteriorly by 5 mm, (d) shifted to the right by 5 mm, and (e) with beam range decreased by 3.5%. Red is the prescription isodose contour lines (76 Gy), green line is the PTV and blue line is the CTV. Letters O and O’ indicate original and shifted positions of the isocenter. Comparison of panel (a) with other panels illustrates that the prescription isodose surface encloses a larger volume for the PTV-based optimization vs robust optimization. At the same time, the CTV remains covered with the prescription dose in the face of uncertainties.

