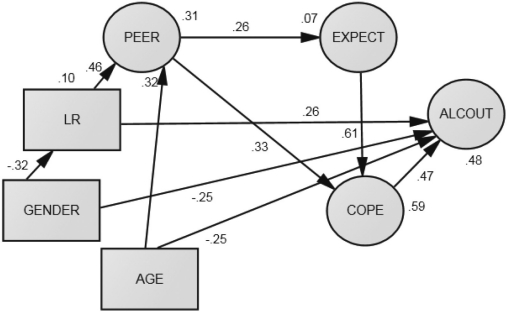
Figure 4.
Structural equation model for 86 offspring. The latent variables here use the indicators from the measurement model in Figure 3 and the abbreviations from Table 1. Only significant paths (p < .05) are presented here with beta weights for path values, and the R2 is reported for each endogenous variable. Here, LR is a retrospective report on the SRE regarding a time 4 years earlier; PEER, EXPECT and COPE relate to the data evaluated at the T25 follow-up of these families; and ALCOUT is from the T30 follow-up.

