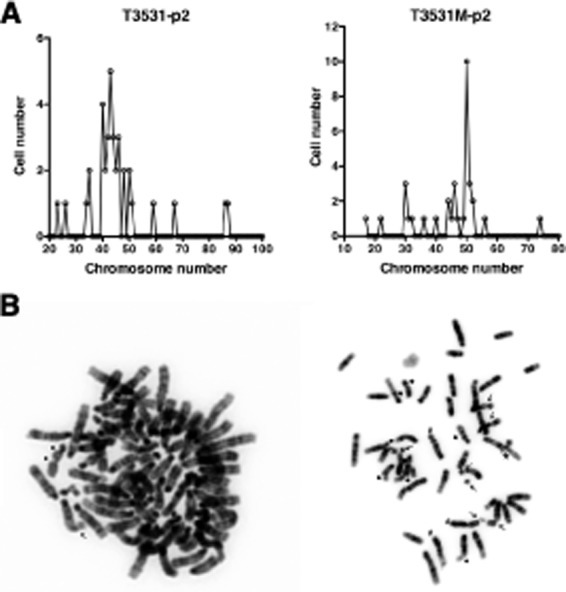
Figure 3. Mouse ATCs display chromosomal instability and aneuploidy.

(A) Chromosome counts in two representative early passage (p2) primary cultures from histologically confirmed ATCs. Note the wide distribution of chromosome numbers within the same culture. (B) Karyotypic analysis of two representative cells from independent tumors, showing chromatid breaks (thick arrows), chromosome breaks (thin arrows), translocations (#), and complex rearrangements (*).
