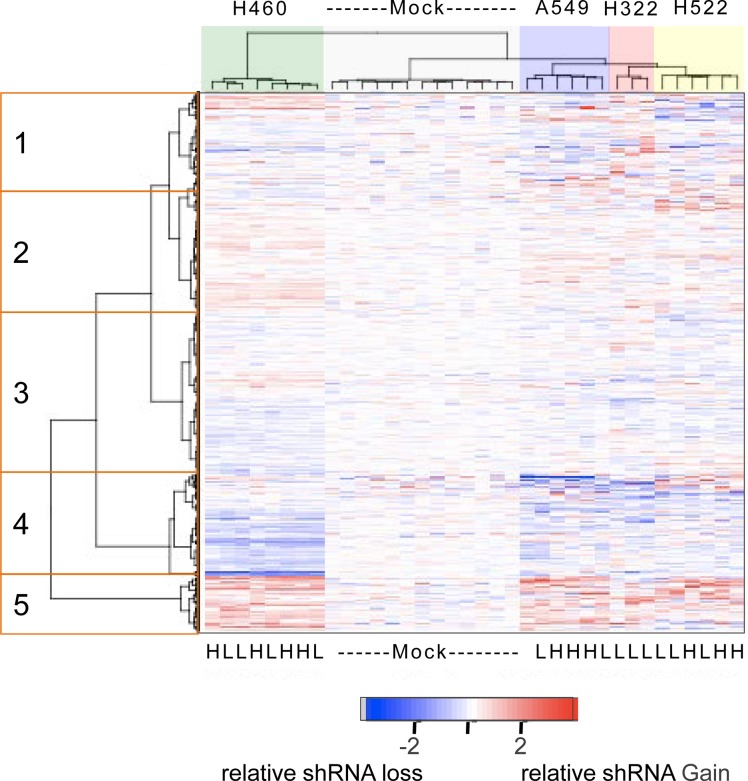
Figure 3. Heatmap of the relative abundance of 3,003 shRNAs in the genomic DNA isolated from mock-treated or GSK461364A-treated lung cancer cell lines.
Both individual shRNAs (rows) and individual cell line treatments (columns) were hierarchically clustered based on the measured abundance of shRNAs relative to the average of mock treatments. The color key indicating relative abundance is on a log2 scale. The mock treatments formed one cluster and each of the GSK461364A treatments clustered according to cell line identity but irrespective of low (IC20) or high (IC80) drug treatment (indicated by L and H at the bottom of the heatmap). The five clusters of shRNAs that are highlighted are described in the text.

