
Figure 1. A miRNA expression profile distinguishes between EOC patients with early and late relapse.
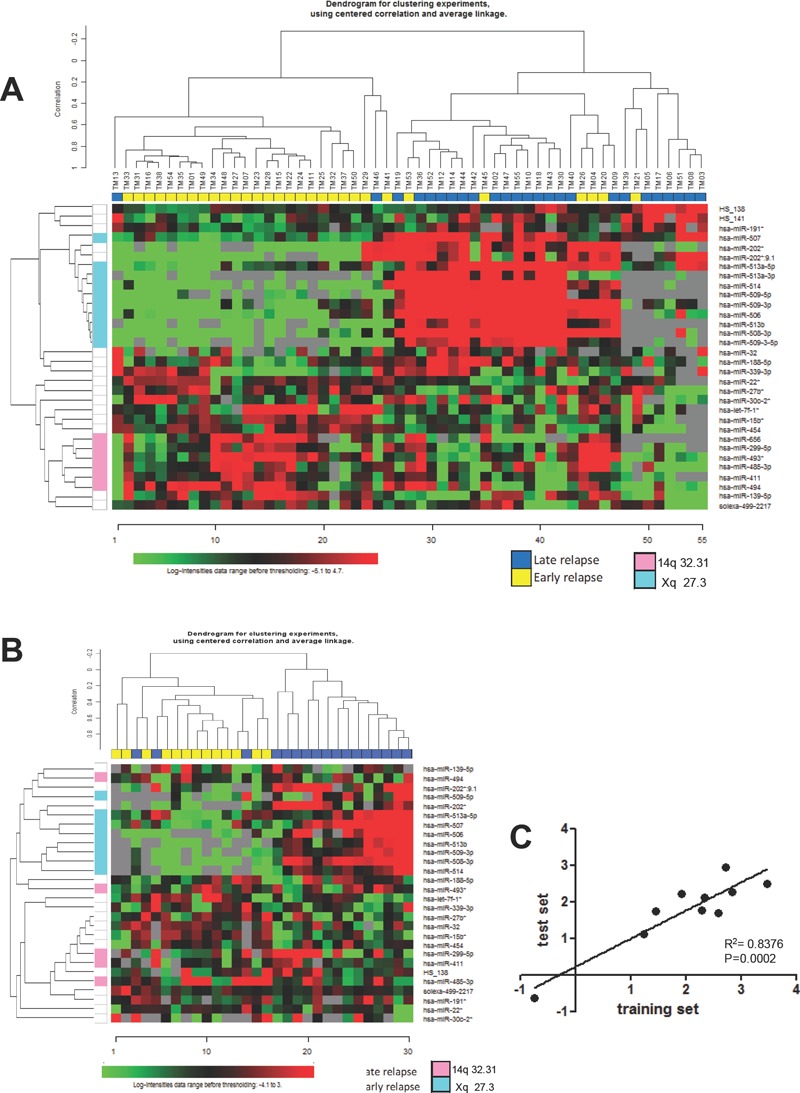
A) Heat map of hierarchical clustering analysis of patients from the training set based on the 32 miRNAs differentially expressed at FDR<10%. B) Hierarchical clustering of patients from test set challenged with the miRNA profile identified in the training set. Twenty-eight of 32 miRNA were detected in the test set. A and B: columns, samples; rows, miRNA expression levels. Red, over-expressed miRNAs; green, under-expressed miRNAs. C) Correlation between training and test sets for the fold changes of the 10 miRNAs identified as differentially expressed in both sets and that maintained a P value <0.01 in the test set (see also Table 2).