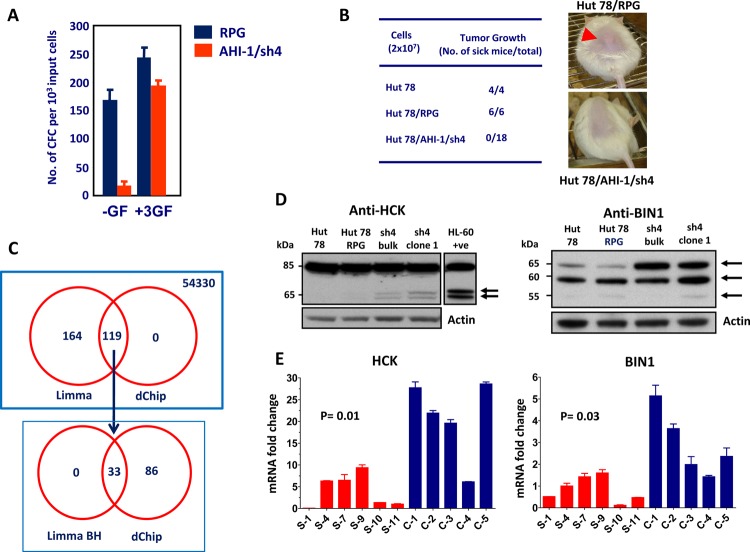
Figure 3. Biological effects of AHI-1 suppression in Hut78 cells and identification of its potential cooperating genes.
(A) The number of CFCs able to make colonies in the absence of any growth factor (-GF) is significantly lower in Hut78 cells with AHI-1 suppression (AHI-1/sh4) compared to the empty vector control (RPG). This effect is rescued by adding the three growth factors (IL-2, IL-4 and TNF-α) to the media. (B) Subcutaneous injection of NOD/SCID-β2m immunodeficient mice with Hut78 cells and empty vector controls (Hut78/RPG) results in tumor formation within 4 weeks in all injected mice. AHI-1-suppressed Hut78 cells cannot form any local tumors in these mice even after 20 weeks. (C) Venn diagram of differentially expressed genes from the microarray analysis selected by both Limma and dChip analyses. Affymetrix GeneChip microarray analysis identified several differentially expressed genes in AHI-1-suppressed cells compared to Hut78 and empty vector controls. Initial Limma analysis selected 283 differentially expressed probe sets, which was further refined to 33 with the Benjamini and Hochberg (BH) P value adjustment. (D) Protein expression of HCK (left panel) and BIN1 (right panel) in AHI-1-suppressed cells (sh4-bulk and sh4-clone1) compared to Hut78 and Hut78/RPG controls. The two isoforms of HCK and the 65 kDa isoform of BIN1 show upregulation in the absence of AHI-1. (E) The mRNA expression levels of HCK (left panel) and BIN1 (right panel) are significantly downregulated in six SS patients (red bars) compared to five CD4+ T cell samples from normal controls (blue bars).

