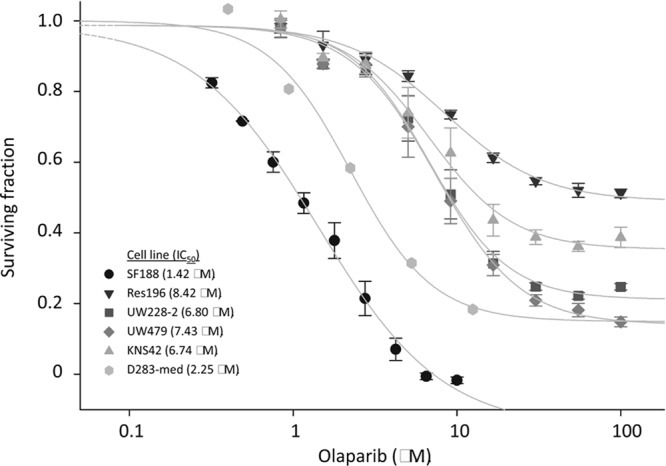
Figure 5. Cell viability assay for pediatric brain tumor cell lines, exposed to the indicated concentrations of Olaparib.

Cell viability was assayed after 96 h exposure. Dots indicate mean values of experiment performed in triplicate. Bars indicate standard error of the mean (SE). IC50 values are calculated using SigmaPlot and are indicated between brackets.
