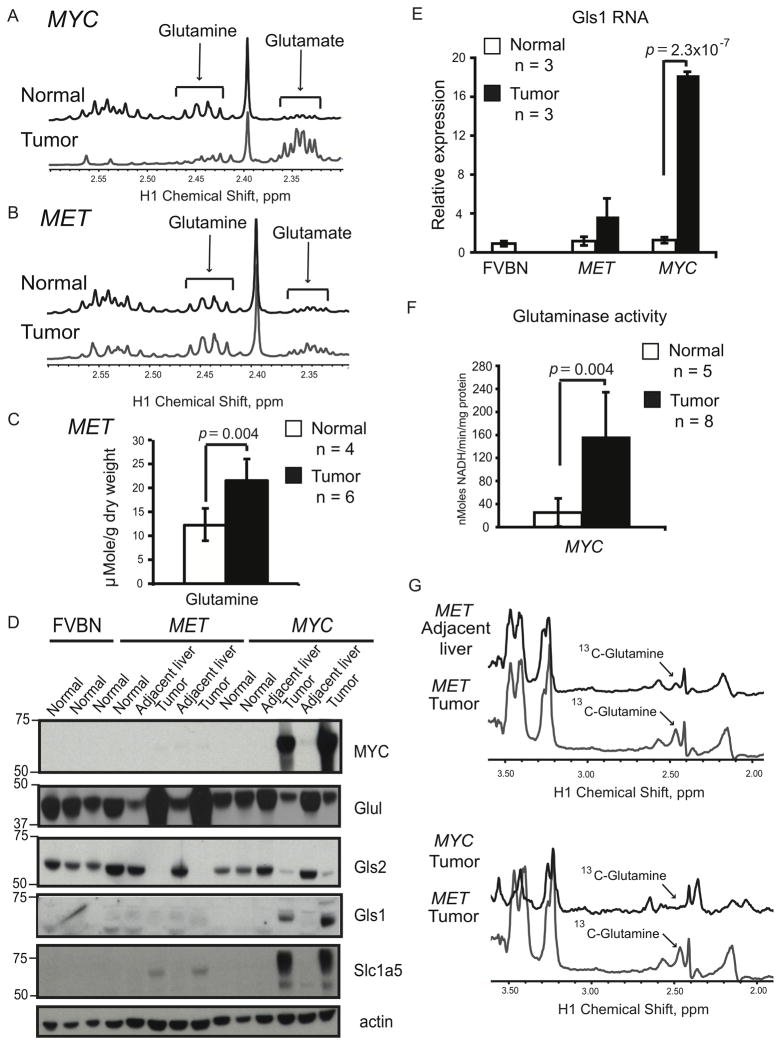
Figure 3. Glutamine Metabolism is Different in Liver Tumors Induced by either MYC or MET.
(A and B) Glutamine levels determined by NMR in tumors and normal livers from transgenic mice kept on doxycycline. Representative 1H NMR profiles of normal livers and tumors are shown (at least four animals per group). Glutamine peaks are in 2.42–2.47 ppm region and glutamate peaks are in 2.32–2.37 ppm region. The profiles were normalized to the initial dry weight. (C) Glutamine concentration quantified in normal livers and MET-induced tumors based on 1H-NMR data in B. (D) Expression of indicated proteins evaluated by immunoblotting of whole tissue lysates using β-actin as a loading control. (E) Gls1 RNA levels measured in normal and tumor tissues using mouse β-actin as an internal control. (F) Phosphate-dependent glutaminase activity measured in the mitochondrial fraction of MYC-induced tumors and normal livers from transgenic mice kept on doxycycline. All values are given as the mean ± s.d. (G) Detection of 13C-labeled glutamine by 1H-13C heteronuclear single quantum coherence spectroscopy (HSQC) NMR performed on extracts of tumor-adjacent and tumor tissues from animals injected with [U-13C]-glucose (5 animals per group). The representative HSQC spectra are shown. 13C-4-glutamine peak is at 2.45 ppm. Consistent with glutamine depletion a corresponding 13C-4-glutamine peak was not observed in MYC-induced tumors. The profiles were normalized to the initial dry weight of tissue. See also Figure S3.

