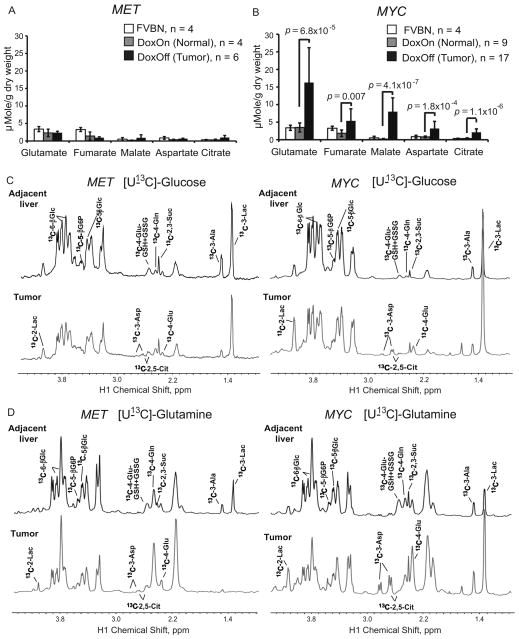
Figure 4. Catabolism of Glucose and Glutamine Contributes to Increased Synthesis of Krebs Cycle Intermediates in MYC-induced Liver Tumors.
(A and B) The levels of Krebs cycle intermediates measured in tissue extracts by GC-MS. Values are given as the mean ± s.d. (C and D) The representative spectra of 1H-13C HSQC NMR performed on extracts of tumor-adjacent and tumor tissues from animals injected with either [U-13C]-glucose (C) or [U-13C]-glutamine (D) (at least 3 animals per group). The profiles were normalized to the initial dry weight. Glc, glucose; G6P, glucose-6-phosphate; Glu, glutamate; GSH, reduced glutathione; GSSG, oxidized glutathione; Gln, glutamine; Asp, aspartate; Suc, succinate; Ala, alanine; Lac, lactate. See also Figures S4.

