
Figure 7.
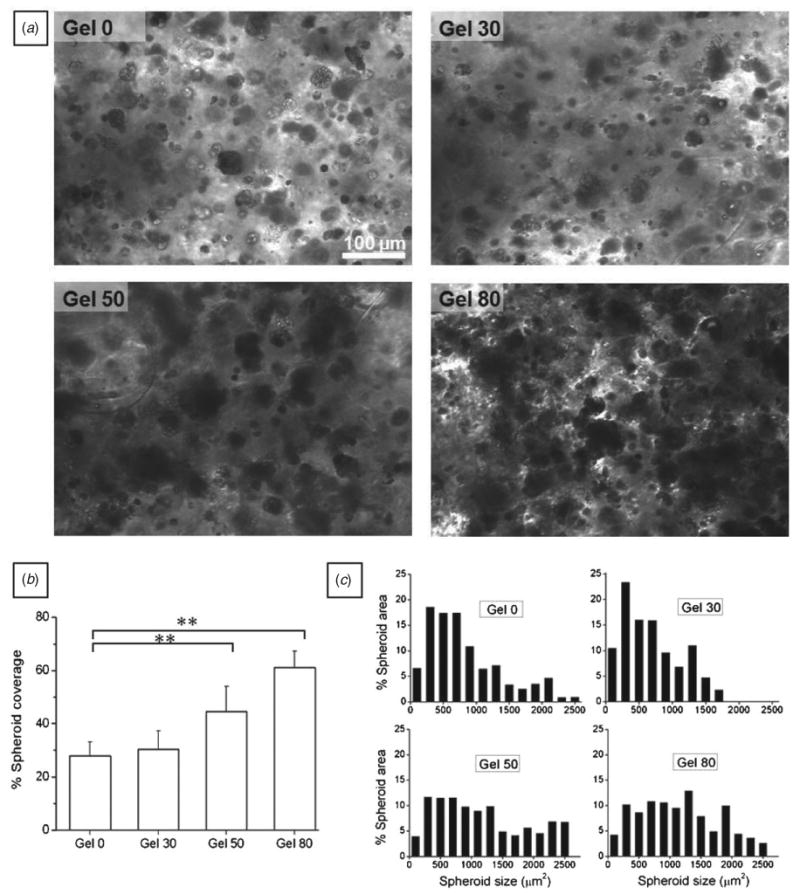
HepG2 spheroid formation after 30 days in culture. (a) Microscopic view of HepG2 spheroids in different alginate hydrogels after 30 days in culture. The spheroids occupied more hydrogel area in gel 50 and gel 80 as compared to gel 0 and gel 30. (b) Bar graph showing spheroid coverage in the hydrogels; hepatic spheroids occupied smaller area in gel 0 and gel 30 compared to higher porosity conditions (mean ± SD, n = 10 images, one-way ANOVA, p < 0.001). Spheroids occupied significantly higher area in gel 50 and gel 80 samples compared to gel 0 (Student's paired t-test, ** p < 0.01). (c) Histogram showing the % spheroid area (μm2) occupied by each size range compared to the total spheroid area; area occupied by larger size spheroids increased with porosity.