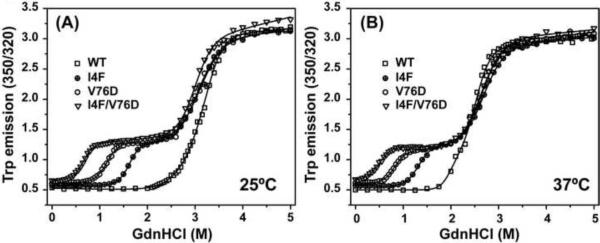
Figure 3.
Denaturant unfolding curves of γD-crystallin mutants at (A) 25 °C and (B) 37 °C. The substitutions lead to the appearance of two explicit transitions compared with the WT monophasic curve. The first transition corresponds to the population of an intermediate with an unfolded N-terminal domain. The second transition corresponds to unfolding of the C-terminal domain. The solid lines represent non-linear least-squares fit yielding the parameters reported in Table 1.

