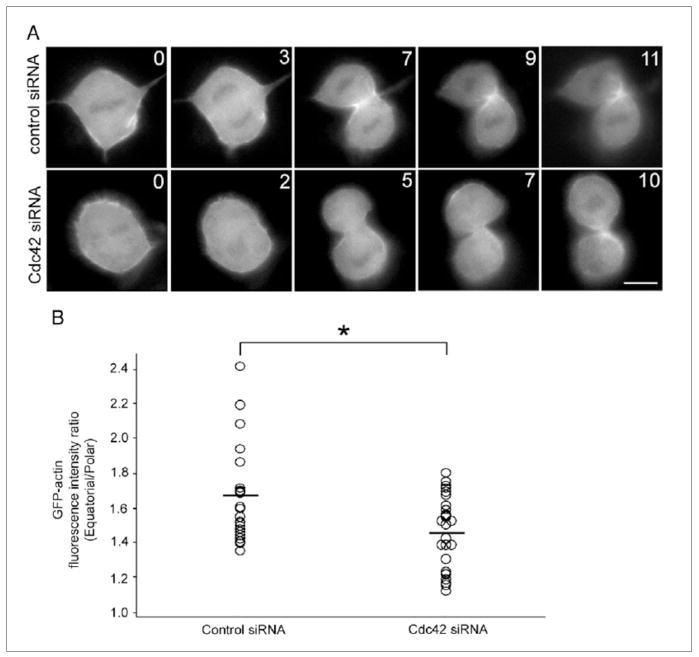
Figure 2. Effects of depletion of Cdc42 on equatorial actin assembly.
(A) Time-lapse fluorescence images of cells stably expressing GFP-actin that are treated with non-target siRNA (Control siRNA) or siRNA against Cdc42 (Cdc42 siRNA). Time elapsed in minutes since anaphase onset is shown at the top-right corner of each image. Scale bar represents 10 μm. (B) Average ratio of GFP-actin fluorescence intensity at the equatorial region to the polar region in control cells (n = 22; Control siRNA) and cells depleted of Cdc42 (n = 27; Cdc42 siRNA). *P < 0.05.

