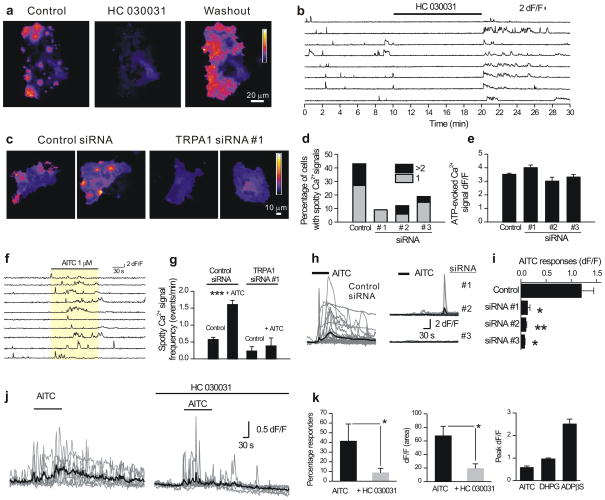
Figure 2. Evidence that TRPA1 channels mediate spotty Ca2+ signals in co-cultures.
a. Maximum projections of a 300 frame video before (control), during and after (washout) of HC 030031 (40 μM). HC 030031 almost completely reduced spotty Ca2+ signals (Supplementary Video 3, from 0.49 ± 0.04 events/min to 0.025 ± 0.01 events/min by HC 030031; n = 96 sites from 11 cells, p < 0.001). b. Intensity versus time profile of eight ROIs. c. Maximal projection of 300 frame video with transfection of control siRNA (right panels, Supplementary Video 4) or TRPA1 siRNA #1 (left panels, Supplementary Video 5). d. Percentage of cells displaying spotty Ca2+ signals. TRPA1 siRNAs significantly (p < 0.01) reduced the number of astrocytes showing spotty Ca2+ signals (Fisher’s exact test, control 43.6%, n=55 cells; siRNA#1, 9.1%, n=22 cells, p = 0.0025; siRNA#2, 12.1%, n = 33 cells, p = 0.0014; siRNA#3, 18.8%, n = 48 cells, p = 0.0052). e. Summary data of ATP-evoked Ca2+ signals measured with Lck-GCaMP3, in control conditions and when TRPA1 siRNAs were used. There was no significant change by TRPA1 siRNA transfection (control 3.5 ± 0.1, siRNA#1, 4.0 ± 0.2, p = 0.105; siRNA#2, 3.0 ± 0.3, p = 0.055; siRNA#3, 3.2 ± 0.2, p = 0.194). f. Numerous spotty Ca2+ signals were seen during the application of AITC (1 μM; Supplementary Video 6). AITC increased the frequency of spotty Ca2+ signals from 0.57 ± 0.07 to 1.6 ± 0.13 events min−1 (p < 0.001). g. Summary data on the frequency of spotty Ca2+ signals with or without AITC. With TRPA1 siRNA#1 transfection, AITC no longer increased the number of the events. h. AITC (20 μM)-induced global Ca2+ transients in astrocytes observed by Fluo-4. i. Average data showing that global Ca2+ signals evoked by AITC are blocked by siRNA against TRPA1. j. 100 μM AITC-evoked global Ca2+ increases measured in astrocytes in the stratum radiatum. The gray traces are representative single cells, whereas the black traces are the averages. k. Summary data for experiments such as those shown in panel j. The right hand bar graph plots the peak dF/F of the AITC-evoked responses (100 μM; n = 19) in relation to those evoked by DHPG (10 μM; n = 33) and ADPβS (30 μM; n = 21). Vertical lines are s.e.m.

