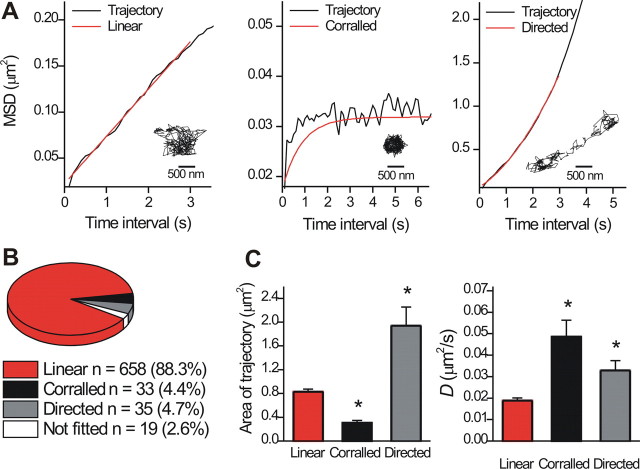
Figure 5.
Lateral mobility of single P2X2FLAG–YFP receptors in the plasma membrane of neuronal dendrites. A, Representative trajectories (shown as insets) extracted from single Qd movies (300 frames) along with their associated graphs of MSD against time interval. P2X2FLAG–YFP receptors displayed three types of MSD plots: linear MSD plots as illustrated in the left, corralled MSD plots as illustrated in middle, or directed trajectories as shown in the right. All three are described in detail in Results. B, Pie chart showing the proportions of the different types of P2X2FLAG–YFP receptor trajectories. C, Summary bar graphs for the average P2X2FLAG–YFP receptor trajectory areas and diffusion coefficients in neuronal dendrites. * indicates p < 0.05.

