
Figure 8.
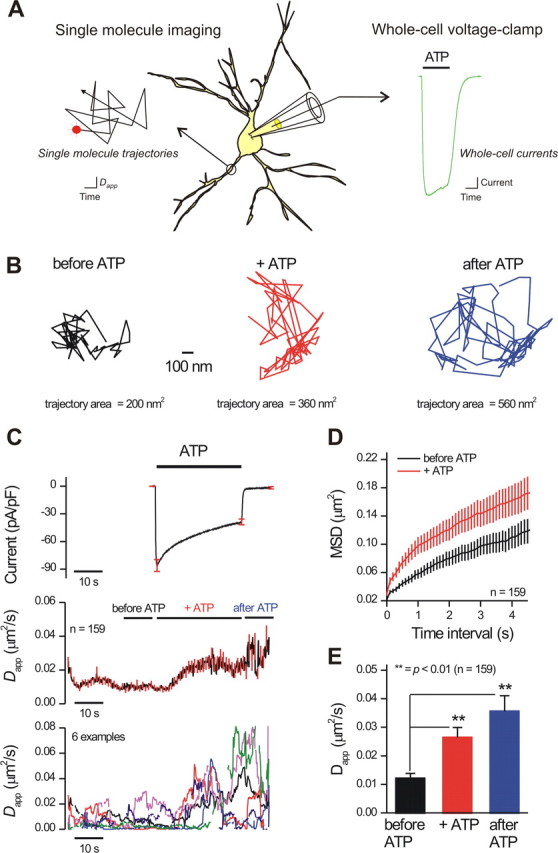
Patch-clamp coordinated single-molecule imaging of P2X2FLAG–YFP receptor mobility during ATP applications. A, The diagram illustrates the experimental procedure. Neurons expressing P2X2FLAG–YFP receptors were labeled with Qds as described in Results and imaged over time with epifluorescence optics. At the same time, whole-cell voltage-clamp electrophysiology was used to measure transmembrane currents before, during, and after ATP applications. ATP was applied using a fast solution switcher that exchanged solutions around neurons within ∼10 ms. We only imaged Qd-labeled P2X2FLAG–YFP receptors on processes because the processes could be imaged in the same z-axis optical plane. The diagrammatic trajectory and ATP-evoked current in A are for illustrative purposes only. B shows representative P2X2FLAG–YFP trajectories before, during, and after applications of 300 μm ATP; the area of the trajectory increased in ATP (see Results for average data). C, The top shows the duration of ATP applications (30 s) as indicated by the solid bar and the resulting ATP-evoked inward currents in neurons (at −60 mV). The black trace is an average of 37 cells, and the red lines represent SEM. The middle graph shows a plot of P2X2FLAG–YFP Dapp over time before, during, and after ATP applications (the red lines represent SEM). There was a significant increase in P2X2FLAG–YFP mobility during ATP application. We standardized measurements of Dapp before, during, and after ATP as shown by the black, red, and blue bars and presented these data in Table 4 and in E. The bottom plot shows six representative examples to provide a feel for the raw data. D shows the first 4 s of average MSD plots for P2X2FLAG–YFP receptor trajectories before and during ATP applications, demonstrating a clear difference in the MSD versus time interval plots when ATP was applied. E, Average data for experiments shown in C for data gathered at the time periods indicated by the solid bars in black, red, and blue. Experiments such as those shown in C–E were performed for 169 Qd-labeled P2X2FLAG–YFP receptors. Of these, 159 trajectories could be fit with a linear function for the MSD plot (D), and 151 could be analyzed to obtain the bar graph (E). **p < 0.01.