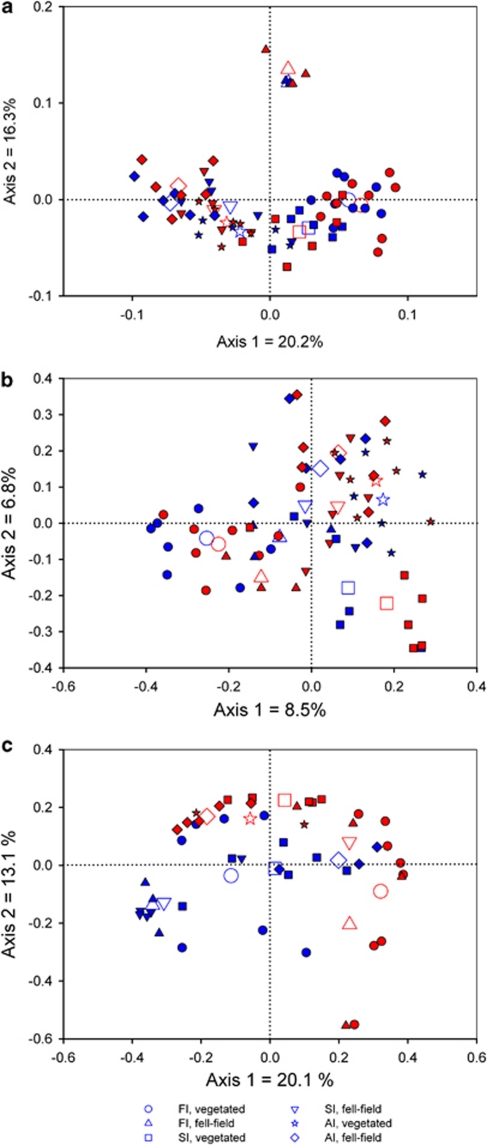
Figure 1.
Principal coordinate analysis based on (a) Unifrac distance calculated from bacterial 16S rRNA gene sequences, (b) Jaccard similarity calculated from DGGE patterns obtained from PCR-amplified fungal 18S rRNA genes or (c) Bray-Curtis distance calculated from GeoChip microarray hybridization patterns for soils from Falkland, Signy and Anchorage Islands. The positions of the larger empty symbols are the mean position for the replicates. Red symbols: OTC plots; blue symbols: control plots.

