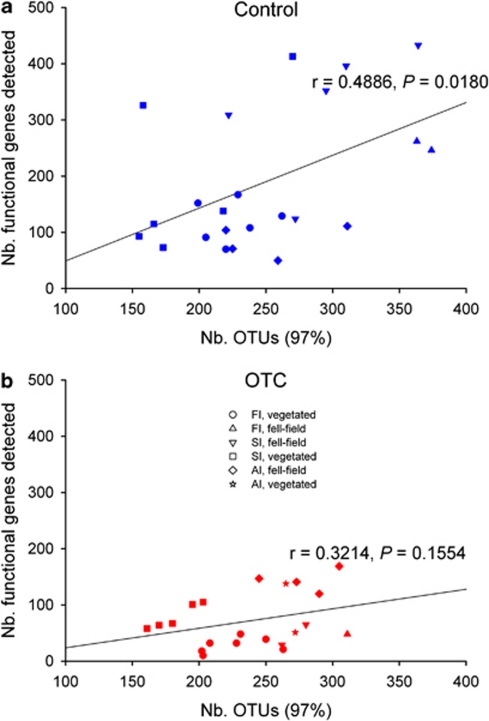
Figure 3.
Taxonomic richness (number of operational taxonomic units, OTUs, at 97% similarity) in relation to functional richness (number of genes detected on the GeoChip) for control and OTC plots across all environments. Pearson's linear correlation and P-values are given next to the trend lines. Missing data points are due to absence of amplification during GeoChip microarray analyses (see Materials and methods for more details).

