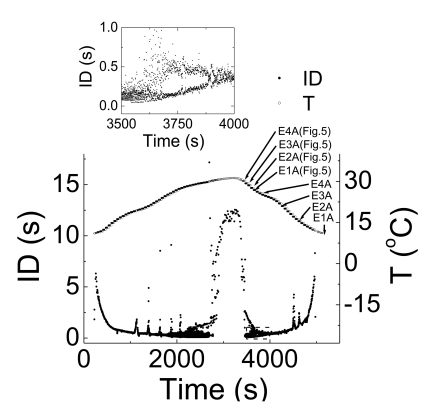
Fig. 2.
Temperature and ID as a function of time. Data acquired from one temperature cycle in Experiment A are plotted. The near symmetry of the graph is taken to mean that the time-dependence of the data to be analyzed is reproducible. The small upper box displays a magnified view from 3,500 s to 4,000 s. The symbols E1A to E4A (Fig. 5), written in the large bottom box correspond to the time series displayed in each panel in Fig. 4E1A to Fig. 5E4A. Sinusoidal bursting with very long burst duration and short IBI is shown by the sign looked like "∧" in the bottom trace.

