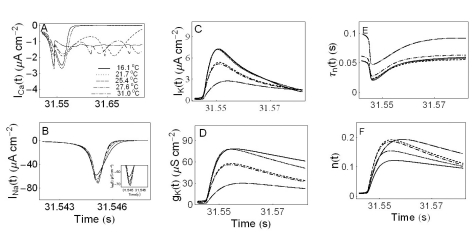
Fig. 7.
Ionic currents and parameters as a function of time. Panel A, B, and C display ICa(t), INa(t), and IK(t), respectively. The solid, dotted, dashed, dash-dotted, dashed-doubledotted lines in panels from A to F are used to represent the variables as a function of time at temperatures 16.1℃, 21.7℃, 25.4℃, 27.6℃, and 31℃, respectively. Panel D displays gk(t). The potassium channel relaxation time constants τn(t) and the probabilities of openings for activation of the potassium channels n(t) as a function of time are shown in panels E and F, respectively.

