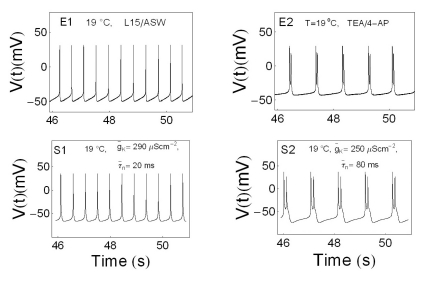
Fig. 8.
Comparison of beating and bursting signals influenced or uninfluenced by drugs with simulation results. Panel E1 and E2 represents time series of APs without drug and with the treatment of drugs mixed with 10 mM TEA and 10 mM 4-AP, respectively. Panel S1 and S2 represents the results of computer simulation with modified Chay-Lee model with temperature-like scaling factors.

