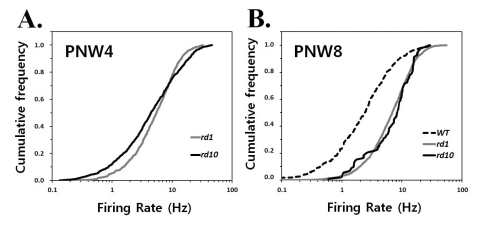
Fig. 2.
Quantification of spontaneous hyperactivity in rd1 and rd10 ganglion cells. Cumulative frequency histograms display the distribution of mean firing rates among all ganglion cells recorded in normal and degenerating retinas at postnatal 4 weeks (PNW4) (A) and 8 weeks (PNW8) (B) The same cells were used as in Fig. 1. Each panel represents the proportion of the ganglion cell population firing at a rate up to the frequency of x axis. A greater proportion of cells is active at higher rates in rd1 and rd10 mice comparing with wt mice, seen as a rightward shift and steeper slope of the histogram curve.

