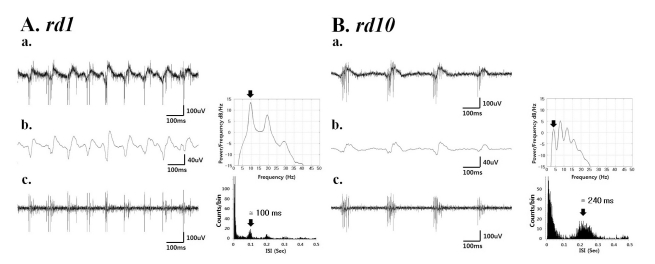
Fig. 3.
(a) A typical raw waveform of neural activity recorded from rd1 (A) and rd10 (B) retina. (b) Field potential waveform (left) obtained from low-pass filtering with 20 Hz cutoff frequency and its power spectral density estimated by the Burg algorithm [23] (right). (c) The spiking activity obtained by high-pass filtering with 100 Hz cutoff frequency (left) shows a temporal structure of rhythmic bursts of spikes, where the interburst interval of ~100 ms (corresponding to ~10 Hz) and ~240 ms (corresponding to ~4 Hz) in rd1 and rd10 retina, respectively.

