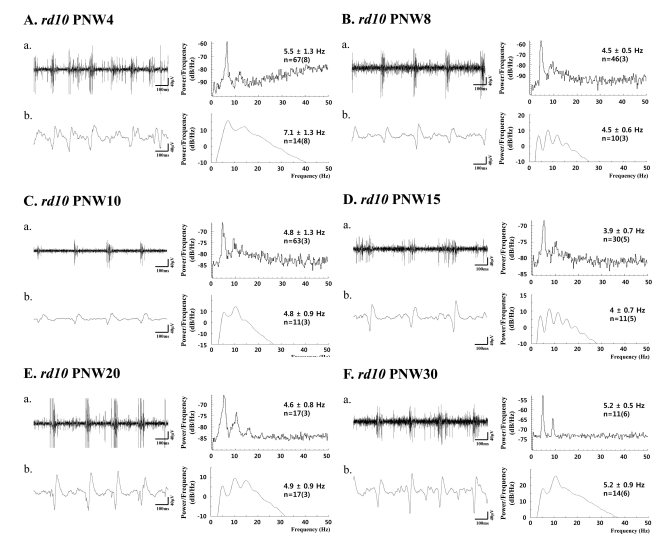
Fig. 5.
(a) Bursting RGC spikes (left) and its power spectrum (right) (b) LFP (left) and its power spectrum (right) in rd10 retina with PNW4 (A), PNW8 (B), PNW10 (C), PNW15 (D), PNW20 (E), and PNW30 (F). RGC spikes and LFP were obtained with high-pass filtering and low-pass filtering as in Fig. 3 and 4. The number of cells is indicated, with the number of retinas in parentheses. Except PNW4, no statistical difference between the spectral peak of bursting RGC spikes and first peak of oscillatory field potential was found among different age groups (ANOVA, p>0.05).

