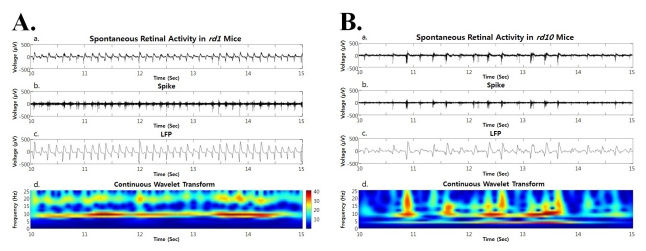
Fig. 6.
Both in rd1 and rd10 mice, the spontaneous retinal activity (a), spike obtained by high pass filtering (b), LFP obtained by low pass filtering (c), and power spectrum through continuous wavelet transform are shown. (A) In rd1 mice, hot spot is only observed at ~10 Hz frequency (Ad). (B) In rd10 mice, hot spot is more prominent at ~10 Hz frequency but substantial hot spot is also found at ~5 Hz (Bd).

