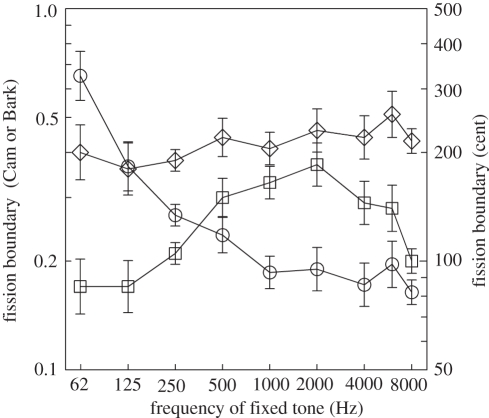
Figure 2.
Results of Rose & Moore [39] showing the fission boundary expressed as difference in the number of Cams or Barks (diamonds and squares, respectively, referred to the left axis) or in cents (circles, referred to the right axis) between the A and B tones, and plotted as a function of the frequency of the fixed tone.

