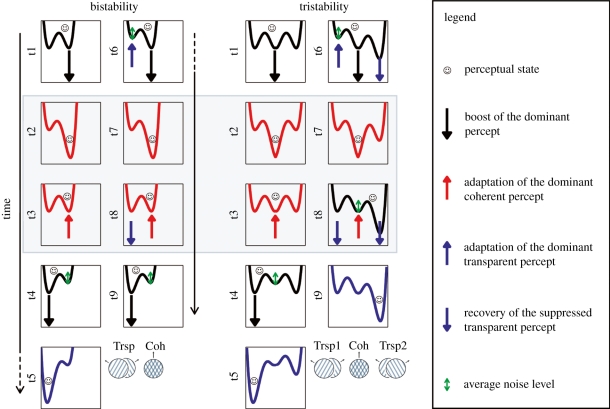
Figure 7.
An illustration of a conceptual model to explain the dynamics of bistable and tristable perception, accounting in particular for the first percept inertia observed for tristable plaids. The representation is that of ‘energy landscapes’ [39–41], which represent the energy state of the system associated with various percepts. The gist of the model is that the system will attempt to find equilibrium in the energy minima (wells of the landscape), but this equilibrium can be perturbed by noise. The depth of a well is thus indicative of the average duration spent in the corresponding percept. Left-hand side: model illustration for bistable perception. We use the cartoon illustration proposed by Kim et al. [42] of a double-well landscape. The figure shows the evolution of the energy landscape at nine key times (t1 to t9, sampled at constant intervals) after stimulus onset (note that the second column is the continuation of the first column). Red colour indicates that the coherent percept is experienced, blue represent the transparent percept and black denotes perceptual transition phases. The position of the smiley face also indicates the perceptual state. In this model, the energy landscape is transformed over time and by the perceptual state. Arrows indicate the directions of changes in the landscape. Those changes are assumed here to be governed by three main mechanisms: adaptation of the dominant percept and noise [40,42–44], plus ‘boosting’ of the percept reaching perceptual awareness. Adaptation occurs only for the currently dominant percept, so the suppressed percept recovers from its previously adapted state (‘adaptation driven oscillatory regime’ [40]). Noise becomes a significant cause of switching only when the dominant percept has adapted. The ‘boosting’ hypothesis provides a role for attention and consciousness [38] in perceptual organization, since it states that a potential perceptual organization is strengthened by being experienced. Importantly, it is sufficient to explain the phenomenon of ‘perceptual stabilization’ whereby the bistable interpretation that was experienced before the interruption of a stimulus is more likely to dominate when the stimulus re-appears [19, 20]. Imagine that, as is the case for many ambiguous stimuli, which percept is experienced first is random (both interpretations are equally likely, i.e. same depth of the energy wells at ‘t1’); once a percept is experienced, it gets reinforced (deeper well at ‘t2’); if the stimulus is removed at that time and then presented again, the energy landscape favours the previously experienced percept. The only specificity of the present model for plaids is the first percept bias: whatever the probability of coherence and transparency, the first percept is supposed to be the coherent one. Reasons for this additional hypothesis are detailed in the main text, in the discussion of local versus global cues. The bistable model predicts no inertia, consistent with the experimental observations (t2 + t3 = t7 + t8). Right-hand side: model illustration for tristable perception. For tristable plaids, we added a third energy well in the landscape representation. Importantly, we placed the ‘coherent’ well between the two ‘transparent’ wells, because switches between two transparency states are typically interleaved with a coherent percept [34]. The grey area on the figure highlights the key difference between bistable and tristable plaids. For bistable plaids, the first (t2 + t3) and second (t7 + t8) coherent percepts (Coh) last on average the same time. For tristable plaids, however, the second coherent percept is shorter (t7) because the competing transparent percept ‘Trsp2’ has a low energy (the ‘Trsp2’ right well at t7 is deeper than any of the ‘Trsp’ wells at t2). The reason for this deeper well is what we called the ‘recovery of the suppressed transparent percept’ at t6 (downward blue arrow). Here we represented only the key events of the dynamics. For example, we did not show the recovery of adaptation for the coherent percept. Formal modelling will be required to specify the respective strengths and time constants of these mechanisms [45]. We also made some implicit assumptions that should be tested or modelled formally. For example, the recovery from adaptation of the previously experienced percept (blue arrow at t8, left-hand side) must finish before the new dominant percept has finished being boosted and adapted (otherwise, in the bistable case, t2 + t3 may not have the same duration as t7 + t8: the energy landscapes of t3 and t8 must be identical). Also, our supposed mechanism of ‘recovery of the suppressed transparent percept’ (which we also called ‘recovery from adaptation’), which is a key mechanism to explain inertia in tristability, may in fact correspond to several mechanisms. In the tristable case described here, we applied such ‘recovery’ to Trsp2 (at t6 and t8) even though Trsp2 had not been experienced yet, so Trsp2 cannot recover from adaptation yet. Here, this mechanism is better understood as some form of coupling between the neural representations of the percepts, with mutual inhibition between competing interpretations [27]. Such coupling would imply that whenever a percept gets strengthened the alternative percept gets weakened, and reciprocally (‘push–pull’ mechanism). The downward blue arrow at t6 would be linked to the upward blue arrow at t6 (adaptation of the dominant transparent percept), and this therefore corresponds to the competition mechanism for figure/ground assignment. The downward blue arrows at t8 would correspond to the competition mechanism between integration and segmentation. In our model, some form of inhibitory coupling appears as one of the mechanisms necessary to explain inertia for tristable perception.

