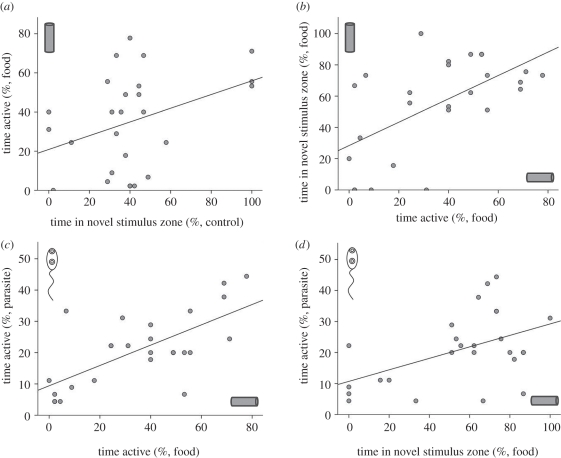
Figure 1.
Scatterplots of statistically significant relationships (using Pearson's correlations) involving individual tadpole activity level (percentage of time points swimming) and exploratory behaviour (percentage of time in same zone as stimulus) within and among recording conditions: (a) exploration in control condition and activity in food condition, (b) activity and exploration in novel food condition, (c) activity in novel food and parasite conditions, (d) exploration in novel food condition and activity in parasite condition. Note: linear regression best lines of fit are only to illustrate the nature of the relationships.

