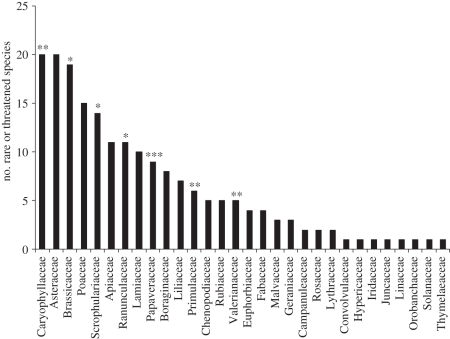
Figure 1.
Numbers of species from each family represented in the short list of rare or threatened European arable plants (cited in questionnaires from at least three countries). The probability of the over-representation of each family in the list when compared with the European flora as a whole, calculated using a hypergeometric probability distribution, is indicated: *p < 0.05, **p < 0.01, ***p < 0.001.

