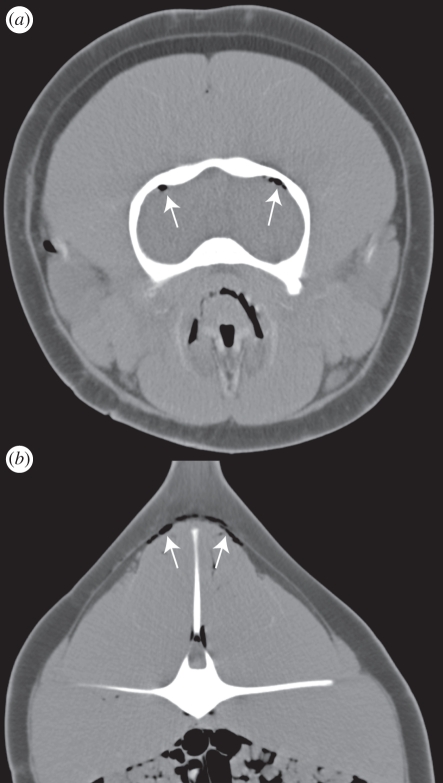
Figure 2.
Transverse CT images from the same animal as in figure 1. (a) Gas within the subarachnoid space or meningeal vasculature (arrows). (b) Gas between the blubber and muscle layers and in linear configurations consistent with intramuscular vasculature (arrows). Intestinal gas is also evident and is normal. Three millimetres slice thickness, soft tissue reconstruction algorithm. (a) WW500 WL50; (b) WW553 WL62.

