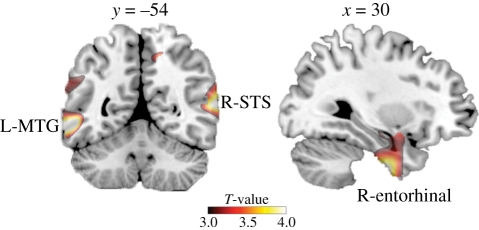
Figure 1.
Grey matter volume correlated with quantitative measure of participation in social networks. Areas where the number of friends reported on Facebook correlated significantly with variability in grey matter density across the entire group (n = 125) are shown superimposed on a standard T1-weighted template brain in MNI stereotactic space. Correlated areas are shown at T > 3.0 for visualization purposes. See table 1 for full details of activated loci. L-MTG, left middle temporal gyrus.

