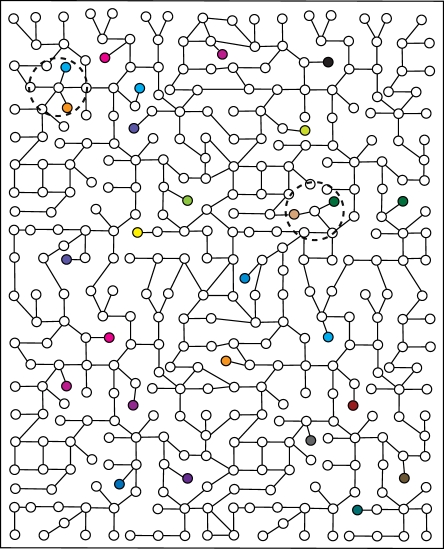
Figure 1.
Connected genotype networks facilitate accessibility of diverse phenotypes. The figure schematically represents a hypothetical set of genotypes (small open black circles) in genotype space (rectangle) that share the same phenotype and form a genotype network; neighbouring genotypes are connected by black lines. Coloured circles indicate genotypes with different phenotypes. The two large dashed circles denote the neighbourhoods of two different genotypes on the genotype network. The upper left neighbourhood contains two novel phenotypes (blue and orange), whereas the lower right neighbourhood contains two different novel phenotypes (beige and green). The figure illustrates that many different novel phenotypes can be accessed from a connected genotype network that spreads far through genotype space. Note that a two-dimensional figure like this cannot capture many features of high-dimensional genotype spaces. These include the fact that individual genotypes can have thousands of neighbours, and not just the few shown here, and that the phenotypes shown in colour also have vast genotype networks that are not shown. Adapted from Wagner [16]. Reprinted with permission from Oxford University Press.

