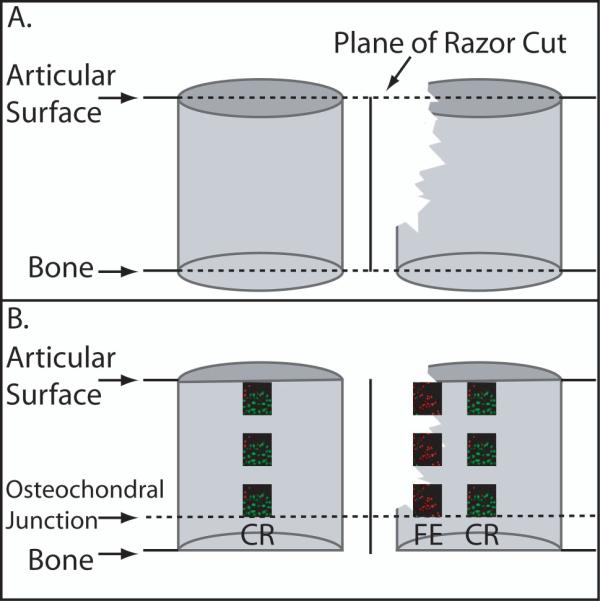
Figure 3.

Schematic of Osteochondral Core Processing. A. Demonstrates the perpendicular razor cut of the osteochondral cores with and without the fractured edge. B. Demonstrates the two regions of interest for confocal analysis of the live/dead assay. CR= Central Region. FE= Fractured Edge.
