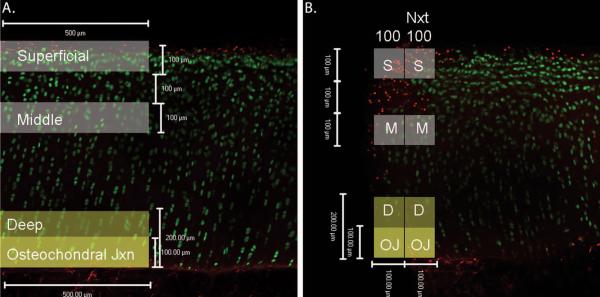
Figure 4.
Live/Dead Assay Confocal Microscope Images. Live cells stain green with Calcein AM stain and dead cells stain red with ethidium homodimer stain. A. Representative image of the central region. Shaded boxes represent the location and size of the cartilage zones that were analyzed. B. Representative image of the fractured edge region with the location and size of cartilage zones used for analyses shaded. The label ‘100’ refers to the first 100 μm from the fractured edge and ‘Nxt 100’ refers to the region 100-200 μm away from the fractured edge.

