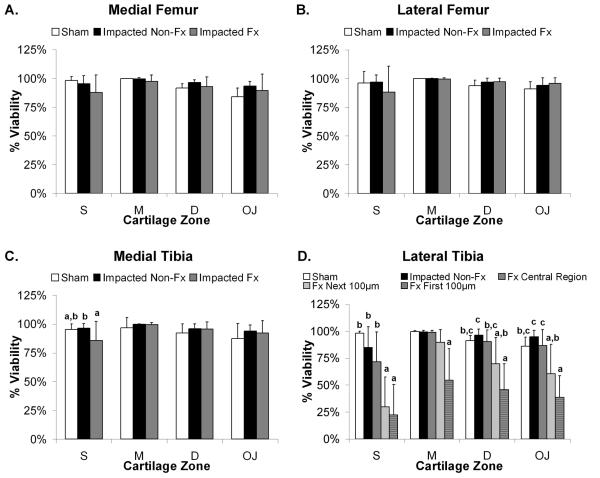
Figure 5.
Chondrocyte viability at the fractured edge is significantly less than the central regions across all impact results and joint quadrants. Bars show cell viability averaged over all time points and reported as mean percent viability + 1 standard deviation for: A. Medial femoral condyle, B. Lateral femoral condyle, C. Medial tibial plateau, and D. Lateral tibia plateau. Bars with different letters are significantly different from one another (ANOVA, p<0.05). S=Superficial Zone, M=Middle Zone, D=Deep Zone, and OJ=Osteochondral Junction.

