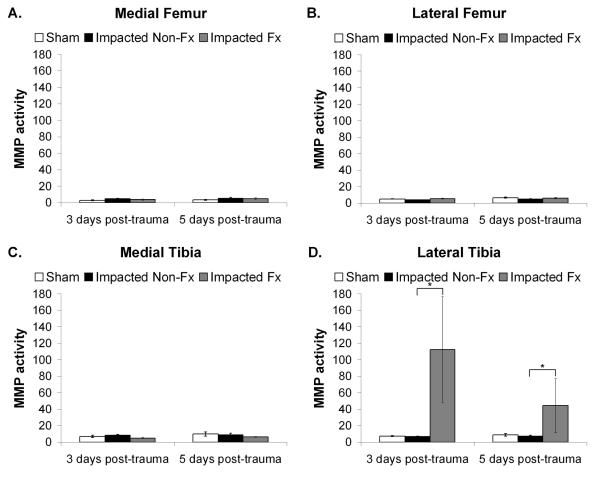
Figure 6.
MMP activity measured in fluorescent units and normalized to volume of cartilage and per 24 hrs of culture time. Data was reported as the mean activity ± 1 SEM for: A. Medial femoral condyle; B. Lateral femoral condyle; C. Medial aspect of the tibial plateau; and D. Lateral aspect of the tibial plateau. (ANOVA, *p = 0.0001).

