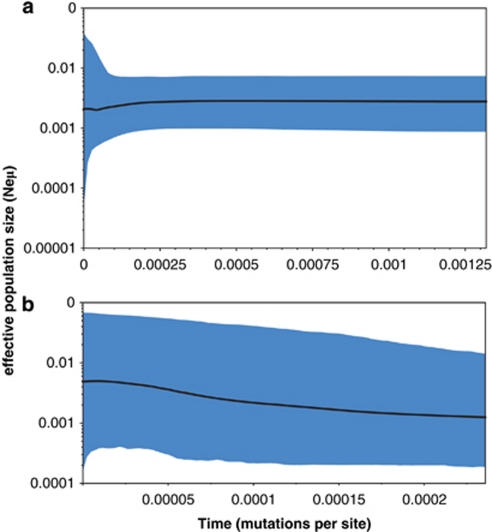
Figure 4.
Bayesian skyline plots based on partial sequences of the mitochondrial control region. Time is measured in mutation units per nucleotide position. The y axis represents a correlate of population size (Neμ). Black lines illustrate median Ne estimation, and grey areas show the 95% confidence interval. (a) Erinaceus europaeus (N=134) and (b) E. roumanicus (N=54).

