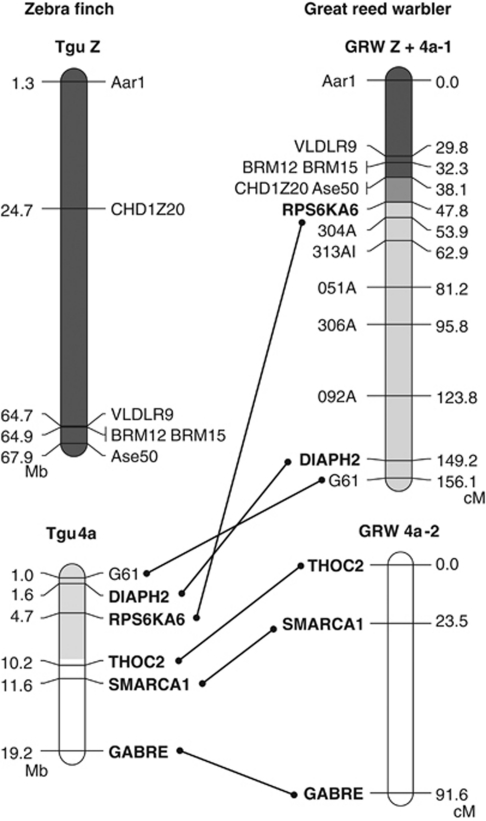
Figure 3.
A best-order linkage map of the great reed warbler neo-sex chromosome. Markers included in the analysis are shown in the left panel of chromosomes and their position on zebra finch chromosomes Z and 4a is indicated in megabases (Mb). Z-chromosome markers are highlighted in dark grey and chromosome 4a loci analysed here are shown in bold (the sex-linked area suggested by our marker analysis is highlighted in light grey). The most parsimonious maps for independent linkage groups Z+4a-1 and 4a-2 are indicated for the great reed warbler. Cumulative genetic distances are given in centiMorgans (cM).

