
Table 1. Mean (and its standard error) of the r2 and the rS2 estimates (over 5000 replicates) of a two-population sample of size (2 × 100).
| r2 | 0.01 | 0.01 | 0.25 | 0.25 | 0.5 | 0.5 | ||||||
| pop 1 pl | 0.9 | 0.9 | 0.9 | 0.8 | 0.9 | 0.7 | ||||||
| pop 2 pl | 0.1 | 0.1 | 0.1 | 0.2 | 0.1 | 0.3 | ||||||
| pop 1 pm | 0.9 | 0.55 | 0.9 | 0.55 | 0.9 | 0.55 | ||||||
| pop 2 pm | 0.1 | 0.45 | 0.1 | 0.45 | 0.1 | 0.45 | ||||||
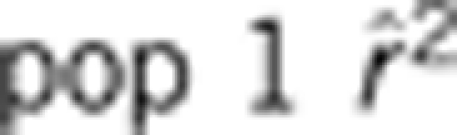 |
0.018 | (0.0003) | 0.015 | (0.0002) | 0.258 | (0.0014) | 0.251 | (0.0007) | 0.504 | (0.0017) | 0.501 | (0.0008) |
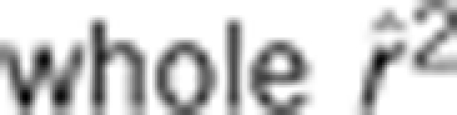 |
0.460 | (0.0007) | 0.022 | (0.0002) | 0.673 | (0.0007) | 0.211 | (0.0005) | 0.801 | (0.0006) | 0.469 | (0.0007) |
 |
0.014 | (0.0002) | 0.012 | (0.0001) | 0.253 | (0.0010) | 0.250 | (0.0005) | 0.502 | (0.0012) | 0.500 | (0.0006) |
p1 is the A allele frequency at the first locus in the first (pop 1) and the second (pop 2) population, pm is the B allele frequency at the second locus in the first (pop 1) and the second (pop 2) population, the r2 measure was estimated with the sample of the first population (pop 1) and with the whole sample (both populations).