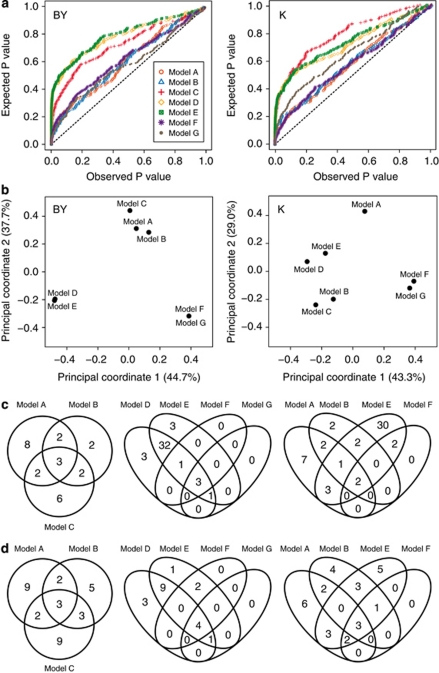
Figure 1.
(a) Cumulative density function plot of all seven models for beet yield (BY) and potassium content (K). (b–d) Comparison of the main-effect QTL detected for the six traits using the linear models A, B and C, and the mixed linear models D, E, F and G. (b) Principal coordinate plot based on pairwise comparisons between the models with regard to model-specific detected QTL. (c, d) Venn diagrams for (c) beet yield and (d) potassium content showing overlapping and model-specific QTL.

