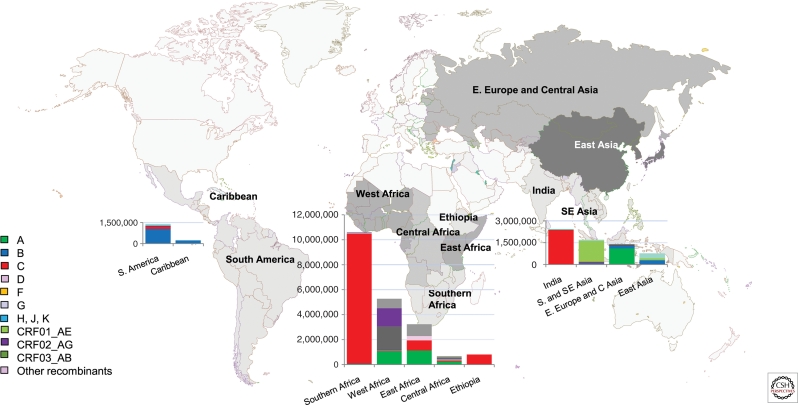
Figure 3.
Regional distribution of HIV-1 subtypes and circulating recombinant forms in low- and middle-income countries. Regions comprising different countries are colored in different shades of gray. The size of the bar is proportional to the size of the epidemic (UNAIDS 2010) with the proportion of the subtypes contributing to each epidemic (as calculated by Hemelaar et al. 2006) illustrated as a percentage of the bar.

