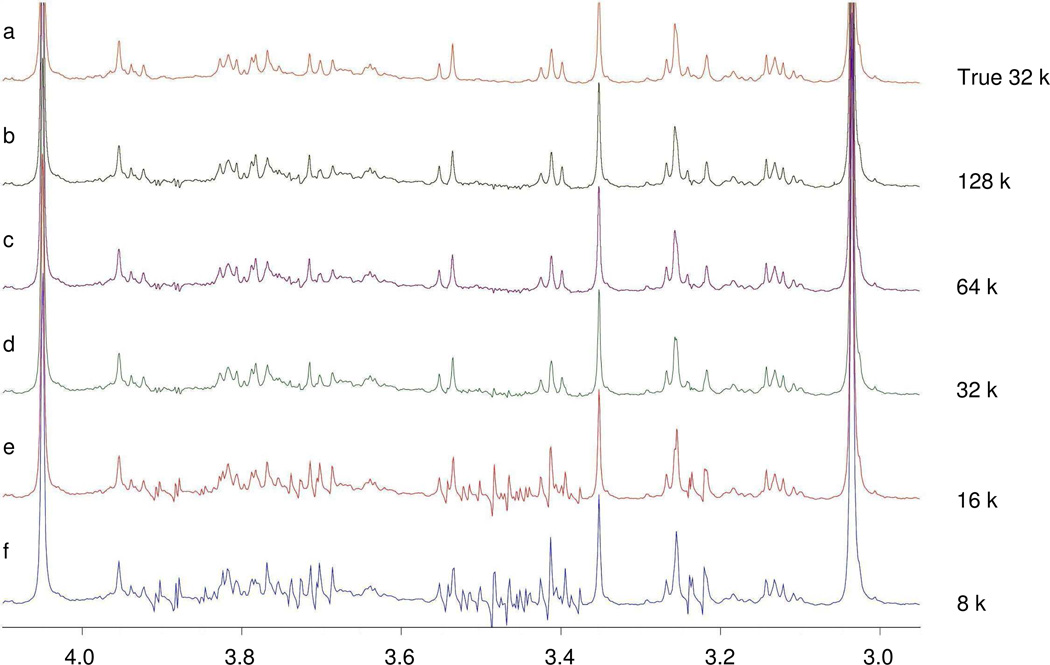
Figure 2.
Impact of spectral resolution on the performance of “Add to Subtract” on sample set 1. (a) Spectrum of the original healthy sample (control); (b)–(f) Metabolite signal uncovered by “Add to Subtract” for the original FIDs (64 k data size, 5 k Hz spectral width) with different digital resolution. Spectra with the two lowest resolutions were enhanced by zero filling the FID before Fourier transformation. The 16 k and 8 k spectra did not provide enough resolution for correct glucose background removal.

