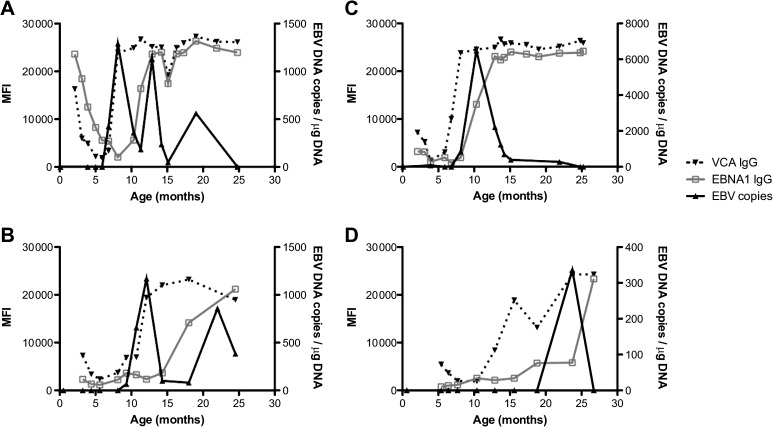
Figure 1.
Representative figures of primary infection detected by first appearance of Epstein–Barr virus (EBV) DNA or by first appearance of EBV-specific antibodies. Data are shown for infants with primary infection with appearance of DNA before and at the same time as antibodies in Kisumu (A) and Nandi (B), as well as infants who have antibodies appear before EBV DNA in Kisumu (C) and Nandi (D). The left y-axis shows the median fluorescence intensity (MFI) of at least 75 beads for the response against each EBV antigen studied. The right y-axis plots EBV viral load. EBV DNA levels, solid black circle and solid black line; viral capsid antigen (VCA) IgG, solid black triangle and dotted line; and EBNA1 IgG, light gray open square and dotted line.

