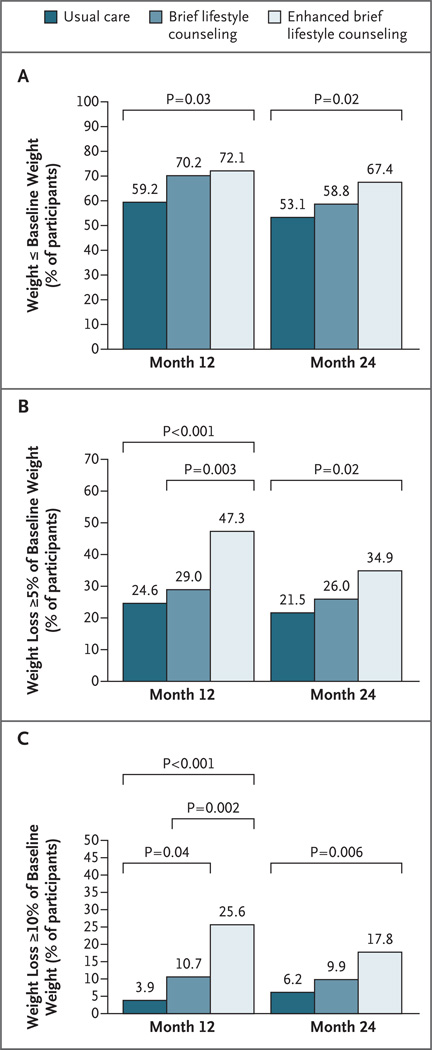
Figure 3. Categorical Weight Loss at 12 and 24 Months.
Panel A shows the percentage of participants in each group in the intention-to-treat population who were at or below their baseline weight at months 12 and 24. (Participants for whom data on weight were missing were assumed to have a weight above the baseline weight.) Panel B shows the percentage of participants who lost 5% or more of their baseline weight, and Panel C shows the percentage of participants who lost 10% or more of their baseline weight. (The percentage of participants who lost 5% or more of their baseline weight includes the percentage who lost 10% or more.)

