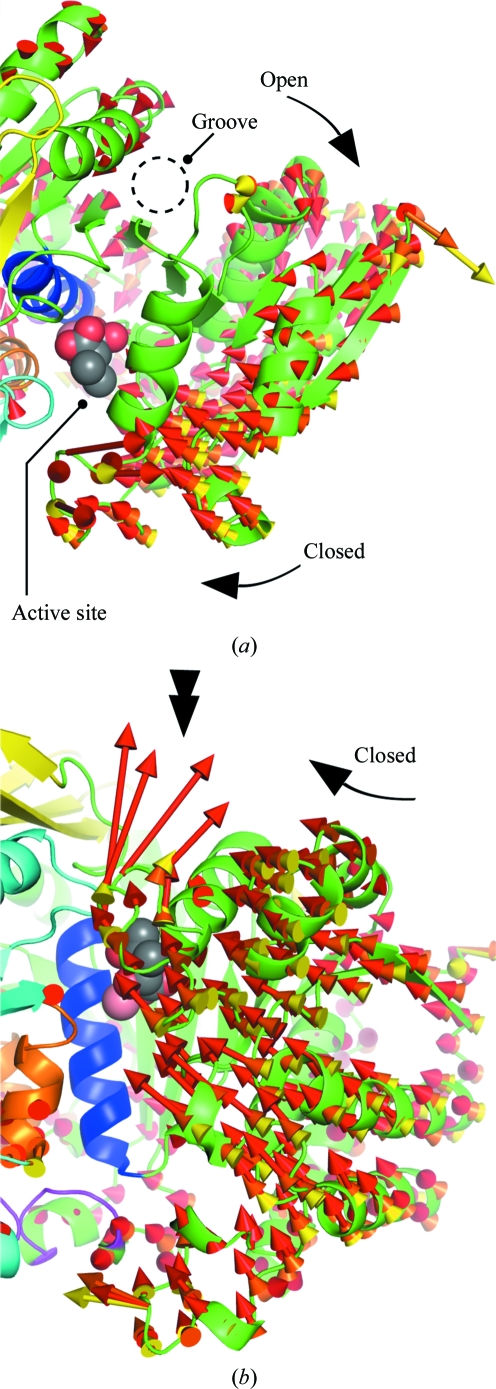
Figure 5.
General displacement between structures at a series of pressures. The vectors between the Cα positions of the atmospheric and the high-pressure structures are represented as arrows (yellow, 340 MPa–0.1 MPa; orange, 410 MPa–0.1 MPa; red, 580 MPa–0.1 MPa). For an easier visualization, the lengths of the vectors are magnified eight times. (a) and (b) are enlarged views of Figs. 3 ▶(a) and 3 ▶(b), respectively. Simultaneous opening of the groove and closure of the active-site entrance can be observed. The double arrow in (b) emphasizes the vectors that represent the large motion described by the Lys81–Glu86 loop.

