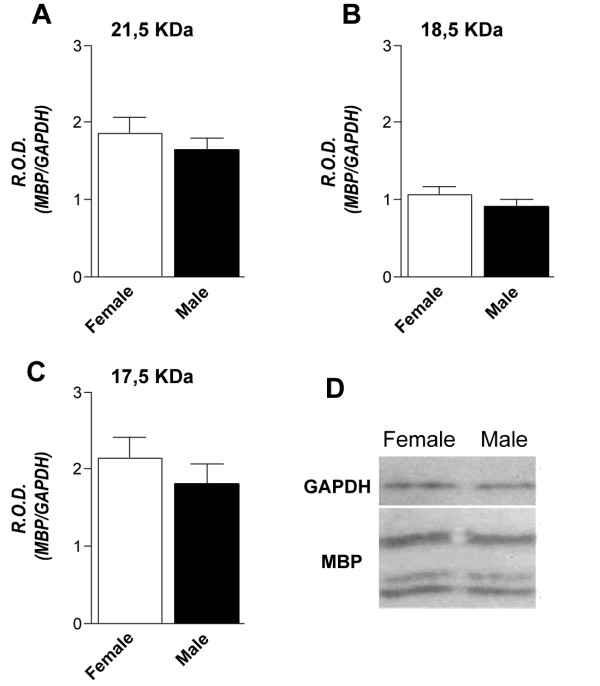
Figure 4.
Spinal cord MBP protein level in control rats. The levels of MBP protein, isoforms 21.5, 18.5 and 17.5 KDa were studied using Western-blot. The graphs in A, B and C show the results of densitometric analysis after normalizing MBP with GAPDH (38 KDa). Results are expressed as mean R.O.D. (relative optical density) values ± SEM. D: representative blot with the bands corresponding to female and male GAPDH (38 KDa) and MBP 21.5 18.5 and 17.5 KDa isoforms. No differences were found between male and female control rats for the investigated MBP isoforms.

