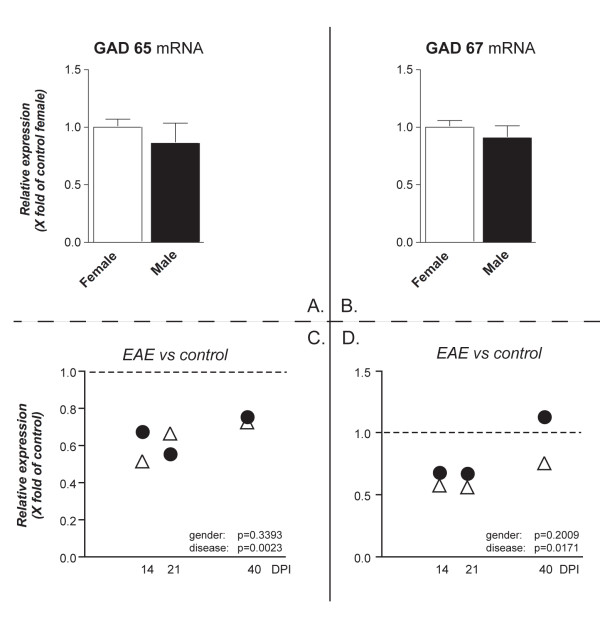
Figure 6.
GAD65 and GAD67 mRNAs expression level in the cerebellum. mRNA levels were studied by real-time PCR. Results are expressed as relative gene expression, from data obtained by using the equation 2-ΔΔCT . Results are presented as mean ± SEM. Eight animals were included in each group (male and female) at each time point. Panels A and B refers to the gender effect in control groups, panels C and D refers to the disease effect. No differences were observed in GAD65 and GAD67 mRNA expression in female and male healthy controls (A, B). Statistical analysis (two-way ANOVA) shows that relative GAD65 and GAD67 mRNA expression in EAE animals is similar in male (white triangle) and female (black circle) rats (p = 0.3393 and p = 0.2009, respectively), whereas both mRNAs differ at different time points (disease effect: GAD65 **p = 0.0023, F(3,52) = 5.528; GAD67 *p = 0.0171, F(3,52) = 3.708).

