
Figure 2.
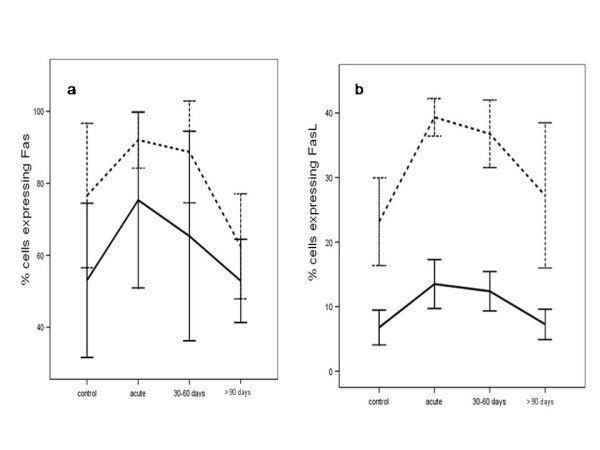
Fas (2a) and FasL (2b) expression during central nervous system tuberculosis in the illness group, before and after specific treatment at the different time periods, and in uninfected children (controls). Results are shown as percentage of Fas and FasL -expressing cells among T-lymphocytes after 24 h (solid line) or within 72 h of culture in complete medium (dashed line).