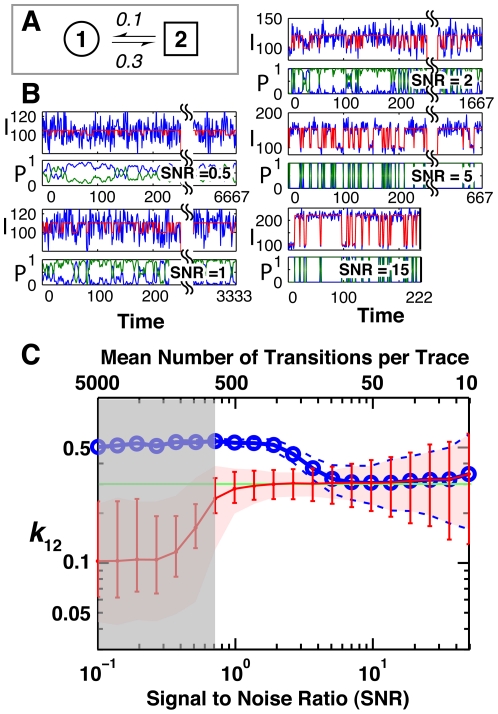
Figure 3. Comparison of HMM and thresholding for identifying the true rate constants from traces varying over a range of SNRs with trace length (not shown) inversely proportional to SNR to account for photobleaching in smFRET experiments.
(A) The two-state kinetic model used in simulating traces over a range of SNRs. (B) Anecdotal traces at five different SNRs, simulated emissions (see Methods) are shown in blue and the true state being occupied is shown in red. Two-state HMM fits are shown below the simulated traces. The blue line indicates the probability of being in state 1 (low intensity) the green line indicates the probability of being in state 2 (high intensity). I and P on the ordinate of the traces indicate intensity and probability, respectively, for each SNR. (C) The average inferred rate constants obtained using thresholding (blue) and HMM modeling (red) as a function of the SNR. The true value, represented by the horizontal green line, is 0.3 (Panel A). The dotted blue line and red swath represent the region that bounds 90% of the determined rate constants from the 500 simulated traces analyzed for HMM and threshold fits, respectively. The mean number of transitions per trace is indicated at the top of the graph. As the difference in signal means for true transitions becomes negligible relative to the noise, the BIC indicates that a one-state fit provides the best fit to the data; this region is shown by the gray swath.

