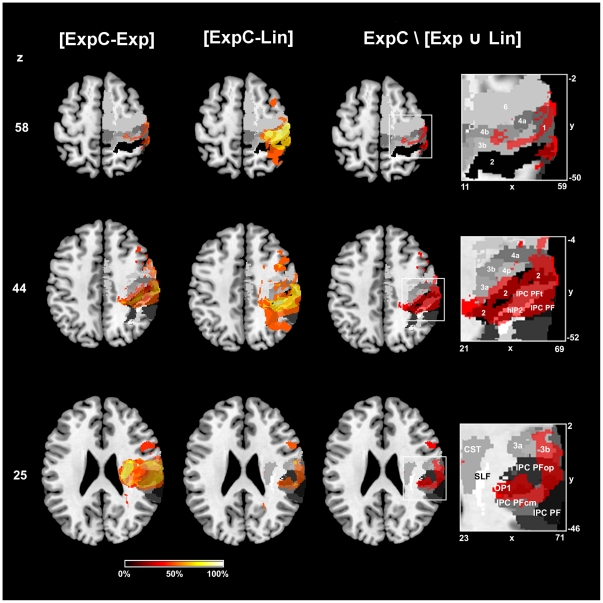
Figure 3. Lesion analysis using subtraction plots and probabilistic cyto- and myeloarchitectonic maps.
First and second column from left represent the subtraction of lesion overlap maps from all patients with impaired recovery outcome (ExpC) versus patients with unimpaired recovery (Exp) and complete recovery (Lin), respectively. Voxels lesioned at least 50% more frequently are shown for both subtractions, increasingly brighter colors indicating increased frequency of damage in subgroup A. Third column and magnified views show in monochromatic red the set difference ExpC\[Exp Lin] superimposed onto cyto- and myeloarchitectonic maximum probability maps (i.e. voxels that have the highest probability of belonging to a given area according to the Jülich histological atlas). This set difference corresponds to all voxels that exclusively belong to group ExpC and are thus associated with impaired recovery. Maps are in shades of grey (SLF in white, area 2 in black). All images are in neurological convention and MNI stereotaxic space. Axial slices are at the level of the hand motor area (z = 58), maximum of cortical damage in group ExpC (z = 44) and maximum of subcortical damage in group ExpC (z = 25). Abbreviations: 6 = premotor area 6; 4a/p = primary motor areas; 3a/b, 1, 2 = primary somatosensory areas (anterior to posterior); CST = corticospinal tract; hIP2 = human intraparietal sulcus 2; IPC = Inferior parietal cortex with subareas PF, PFt, PFop, PFcm; OP1 = opercular area 1; SLF = superior longitudinal fascicle. x/y/z = MNI coordinates in mm.

