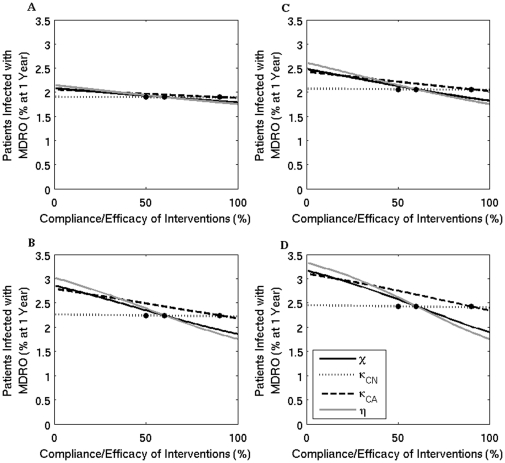
Figure 6. The percent of patients infected with an MDRO at one year when the compliance or efficacy of four interventions are varied for four transmission levels.
Solid black line ( ) - contact precautions, dotted line (
 ) - screening of colonized patients not on antimicrobials, dashed line (
 ) - screening of colonized patients receiving antimicrobials, and grey line (
 ) - compliance with hand hygiene measures. The dots mark the baseline values. (A)
  ; (B)
; (B)  - baseline value used in other simulations; (C)
  ; and (D)
  .
.

